Parts List:

Video Tutorial:
Setting up the Hardware
- VIN -> 5V
- GND -> GND
- SCL -> SCL #3 PIN3
- SDA -> SDA #2 PIN5

Setting up Node-Red
First we’ll investigate the BME node and how it works
Drag in a Bme node and an inject node into the flow.

First double click on the Bme280 node and take a look at the settings it provides.

None of these settings need to be changed, but taking a look at them provides some insight into how the BME sensor works with node red.
First of all is the Name, this is just the name that the node will show in the flow; this can be left blank if you want.
Next is the Bus# and i2c address, I’ll discuss those together.
The BME-280 is an i2c device, that means it talks to the rpi in the language of i2c using the i2c connector.
i2c is a type of connection that allows multiple different devices to connect to the same physical connection (the same bus), and differentiate themselves by address. This is kind of like living on the same street (bus) as someone else, the mailman can still deliver letters to you because he can just check the address on your letters to make sure it goes to your house instead of your neighbors.
Because i2c devices have addresses we could theoretically connect another bme-280 with a different address to the exact same wires used to wire up the first one, and they would both still work without interfering with each-other at all.
The address of the BME is actually built into the hardware, so it will never change. So we can just leave the address setting in node-red at the default.

To test out the BME drag in an inject node and a debug node and wire them up as pictured.
The way the BME node works is that it’ll only give us data when prompted, so we need use an inject node to ‘activate’ it.
The debug node will allow us to inspect the data that comes out the other side.

After hitting deploy, and activating the inject node a few times you can see the data in the debug tab.
As you can see, the payload contains attributes packaged together in one message. Like many nodes in node-red, it’s outputting a json object containing multiple data points at once.
While it’s fine to view the data in the debug tab, if we ever want to use a specific field (like temperature) without bringing along everything else we’ll have to separate it.

To access the attributes individually we’ll use a change node, connected between the bme node and the debug node.


Double click on the yellow change node and change the dropdown on the bottom from ‘string’ to ‘msg.’
And then enter ‘payload.temperature_C’ into the box.
This will tell the change-node to take the structured input, and reach in to grab the ‘temperature_C’ property alone.
if you deploy the flow again, and activate the inject node you can see the node in action, as we get the temperature instead of the json object in the debug tab.

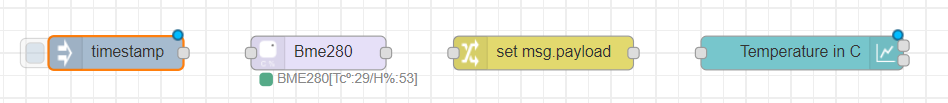
Next we’ll setup the dashboard graph, remove the debug and inject nodes and replace them with a chart node like this:

Drag and drop the chart node from the dashboard section onto the workflow.

7) Double click the chart node to edit the node. On the group field, click on the pencil button.

8.1) On the Tab field, click on the pencil button again.

8.2) From there, click on the Update button to return to the previous menu, then again to return to the original menu. This is to confirm the dashboard view settings. On the original menu, we can adjust the graph’s design, color, label, etc. Let’s proceed with labeling our chart “Temperature in C”. Click Done once completed.

9) To have the BME280 send data at an interval, place an inject node from the input tab onto the workflow.
9.1) Set the payload to number and enter 1 (means ‘on’ for the computer) in the field. Set Repeat to interval and set the interval time to any desired time (good to start at 5 seconds). Click Done once completed.

10) With all the nodes configured, connect all the nodes and hit Deploy.

11) Navigate to the Dashboard page to view your graph(s): 127.0.0.1:1880/ui/#/0

Node-RED Palette Installation (node-red-contrib-bme280)
1) Click on the menu icon in the top-right corner of the window and select Manage palette.

2) Navigate to the Install tab.

3) In the search modules bar, type in node-red-contrib-bme280 and click install.
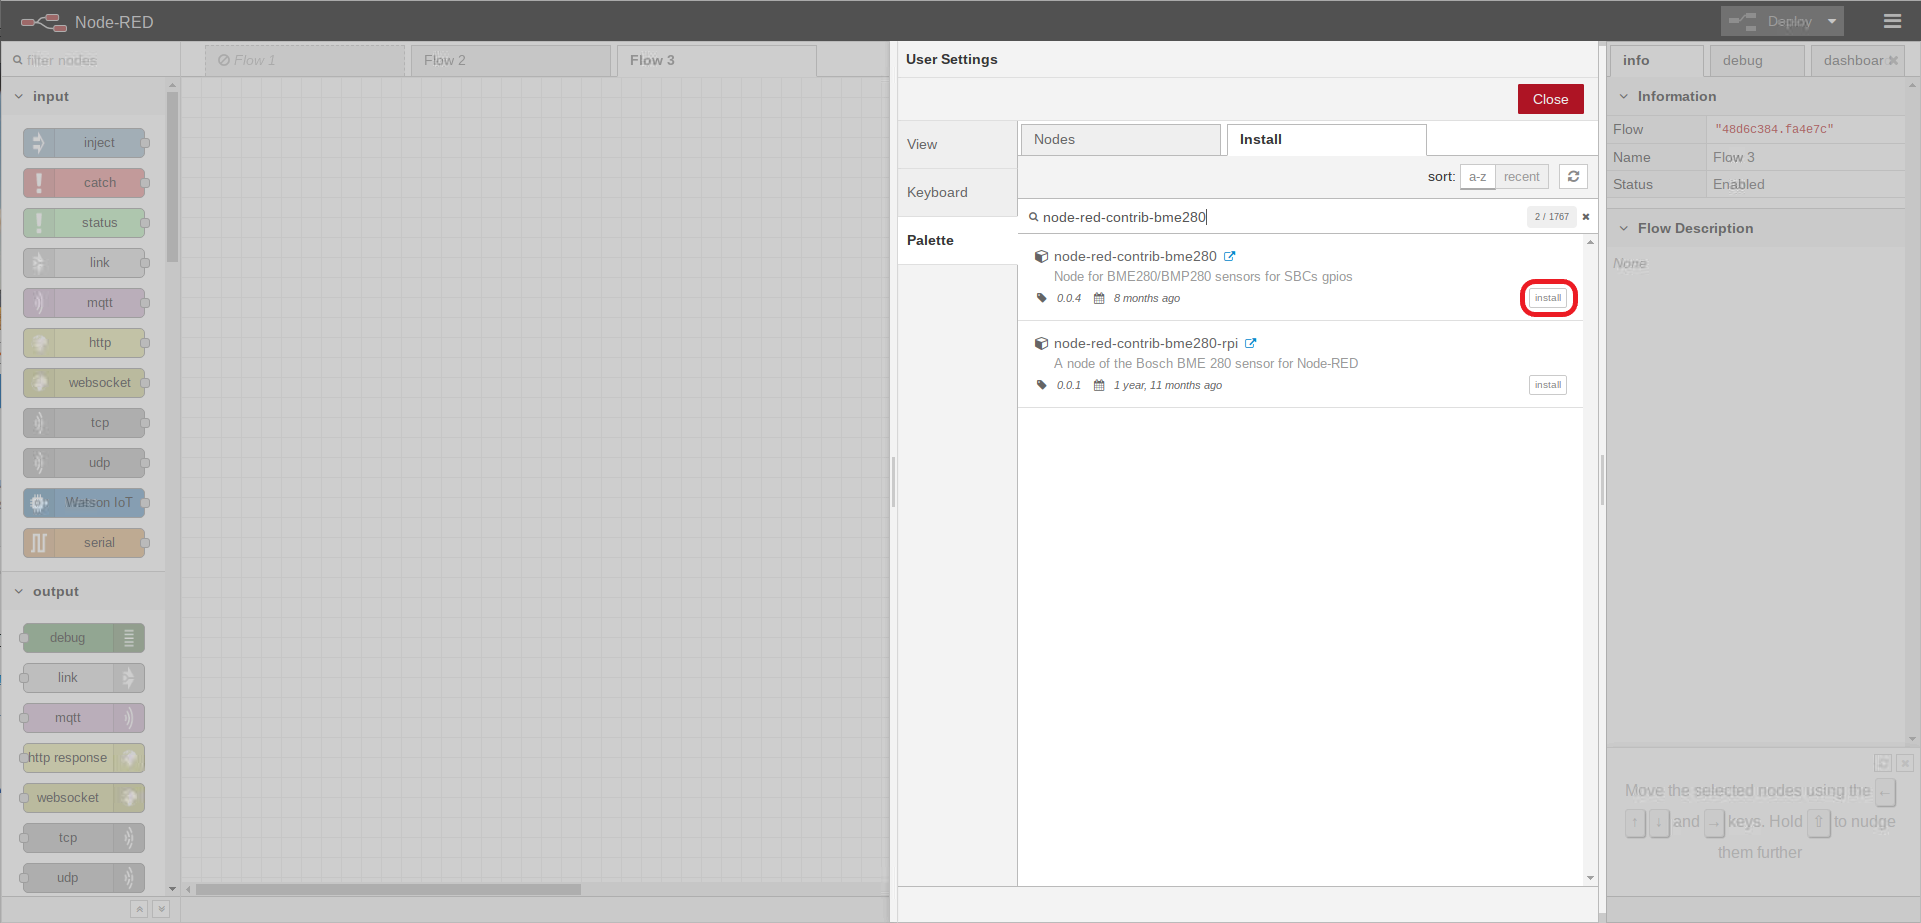
4) An installation window will pop-up. Click install.

Next Steps: